obs-stats
A btop-style terminal dashboard for OBS Studio.
Watch CPU, frame pacing, encoder health, outputs, scenes and audio — live, from a terminal, over obs-websocket 5.x. Get told the moment frames start dropping. One static Rust binary. No daemon.
Why not just the OBS stats dock?
OBS tells you that frames were dropped. It does not tell you which pipeline dropped them, whether it started five minutes ago, or whether the cause was your GPU, your encoder, or your uplink. Those have different fixes.
Three loss channels, kept apart
Renderer skips are a GPU problem. Encoder skips are a CPU problem. Network drops are an uplink problem. They are never merged into one number.
Counted per stream
OBS reports totals since it launched. obs-stats captures a baseline when you go live, so yesterday's numbers can't hide today's problem.
Warning before loss
Frame render time against the frame budget, and encoder congestion, both move before anything is dropped — which is the moment to act.
A verdict, not a number
Drop rates, congestion, frame budget and FPS-against-target reduce to one word you can read from across the room.
It tells you, unprompted
You are presenting, not watching a terminal. Frames actually being lost raise a banner across every view and a desktop notification naming the cause and the fix.
Meters that mean something
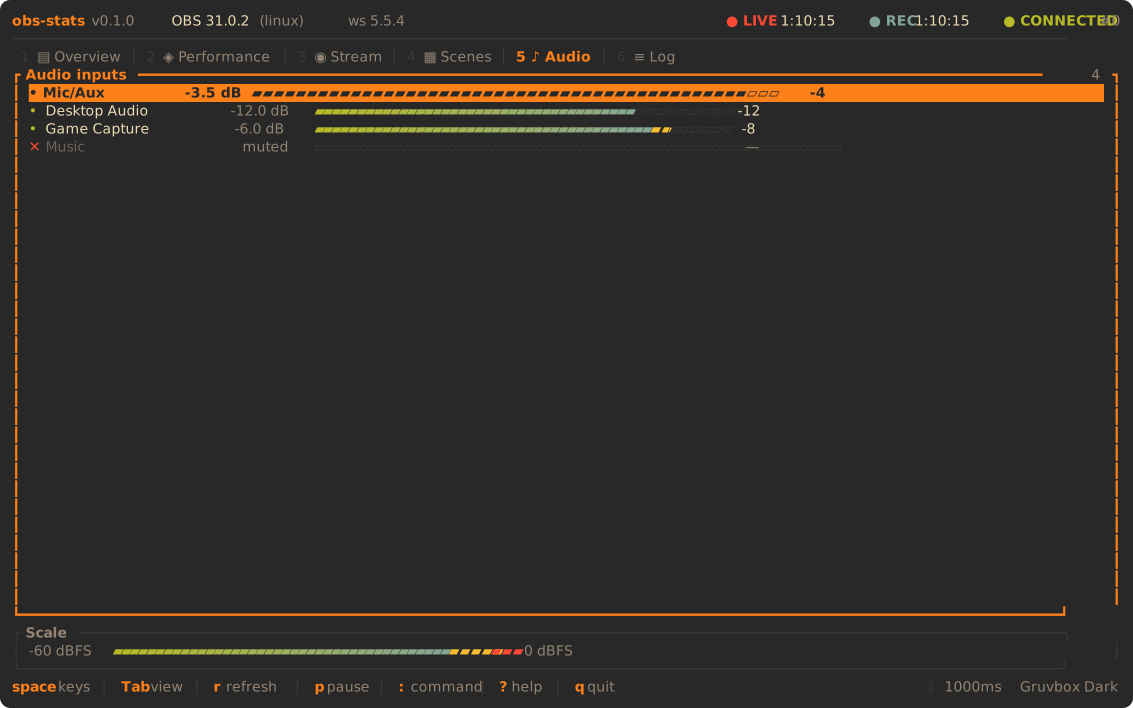
Audio drawn on a dB scale, not a linear one, so speech at −20 dBFS fills two thirds of the bar instead of looking like silence.
Secret-safe by design
The password comes from an environment variable and is never written to config, logs or error messages. The config file is always safe to commit.
Six dashboards, one keypress apart
Press a digit, or Tab through them.
Overview
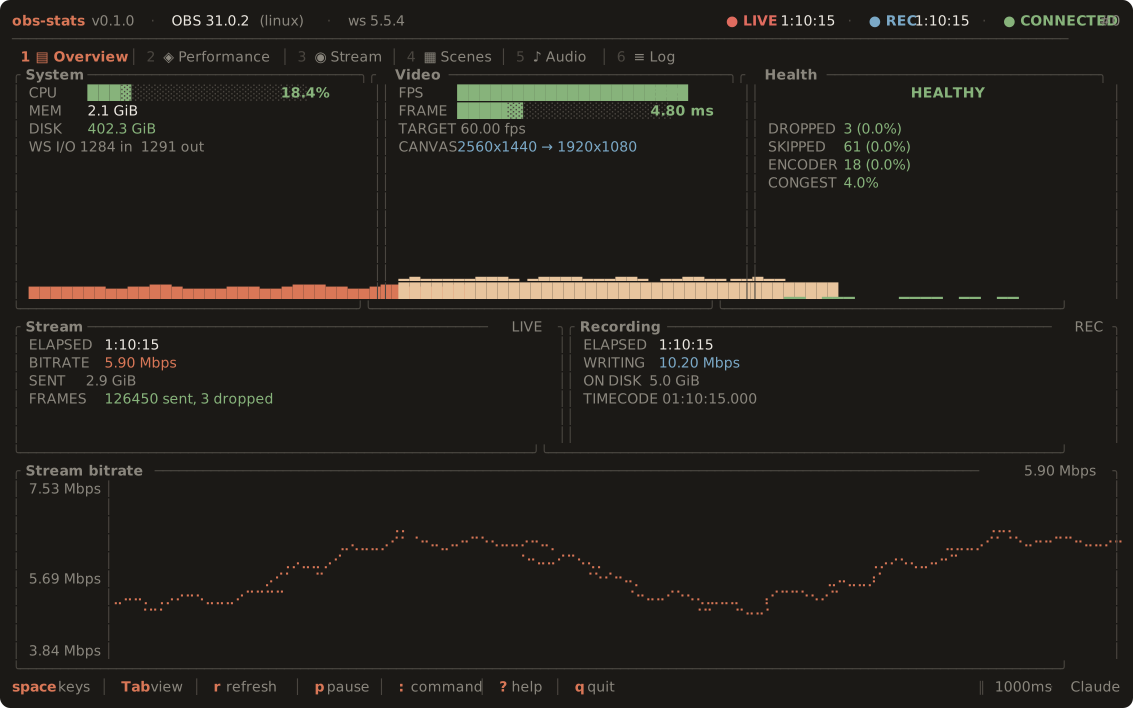
1System load, video pipeline and a health verdict across the top; the live stream and recording outputs below; a bitrate chart along the bottom.
Performance
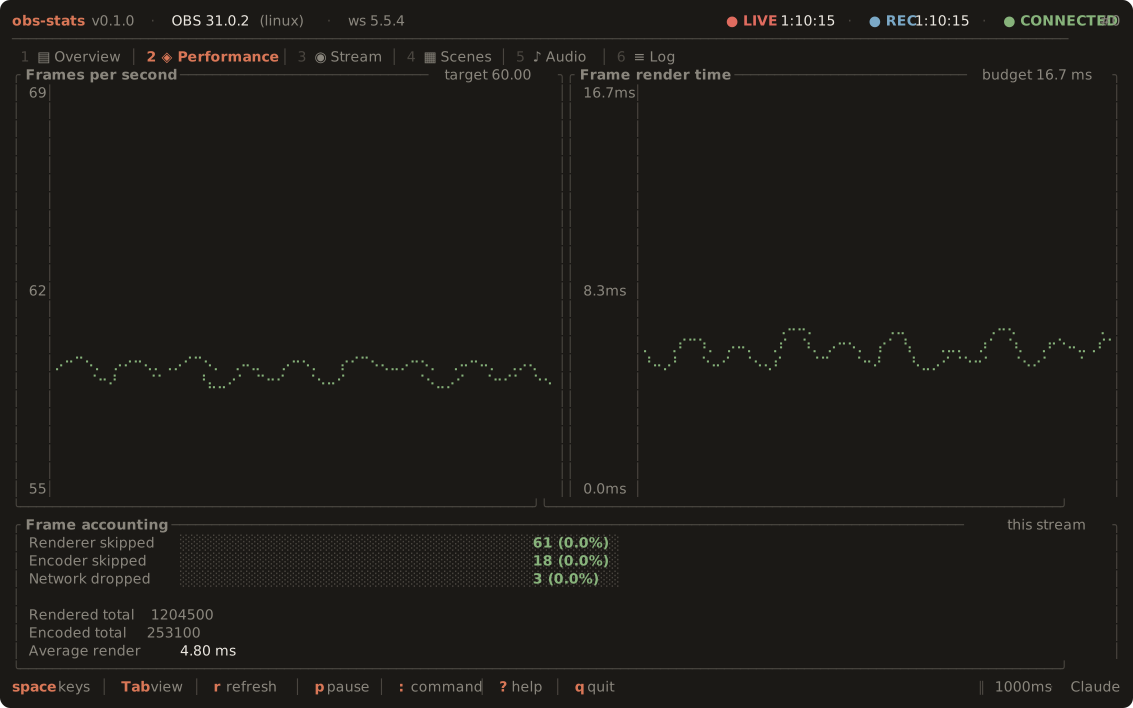
2Achieved FPS against the configured target and average render time against the frame budget, over an accounting panel that separates the three loss channels.
Stream
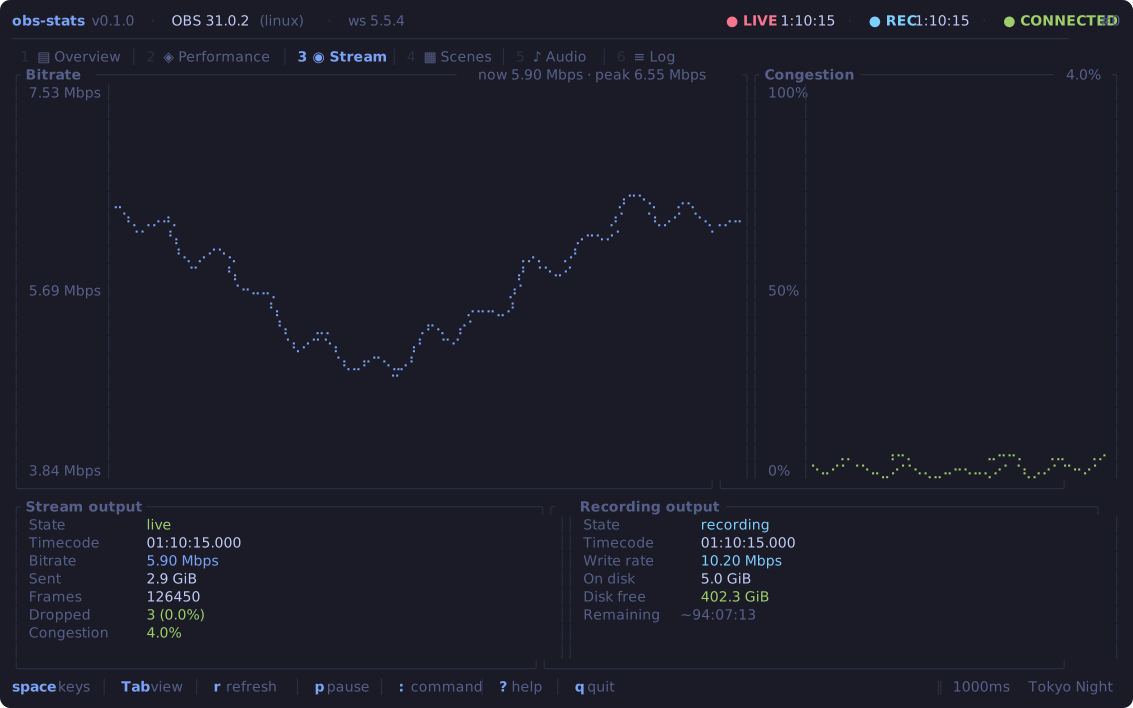
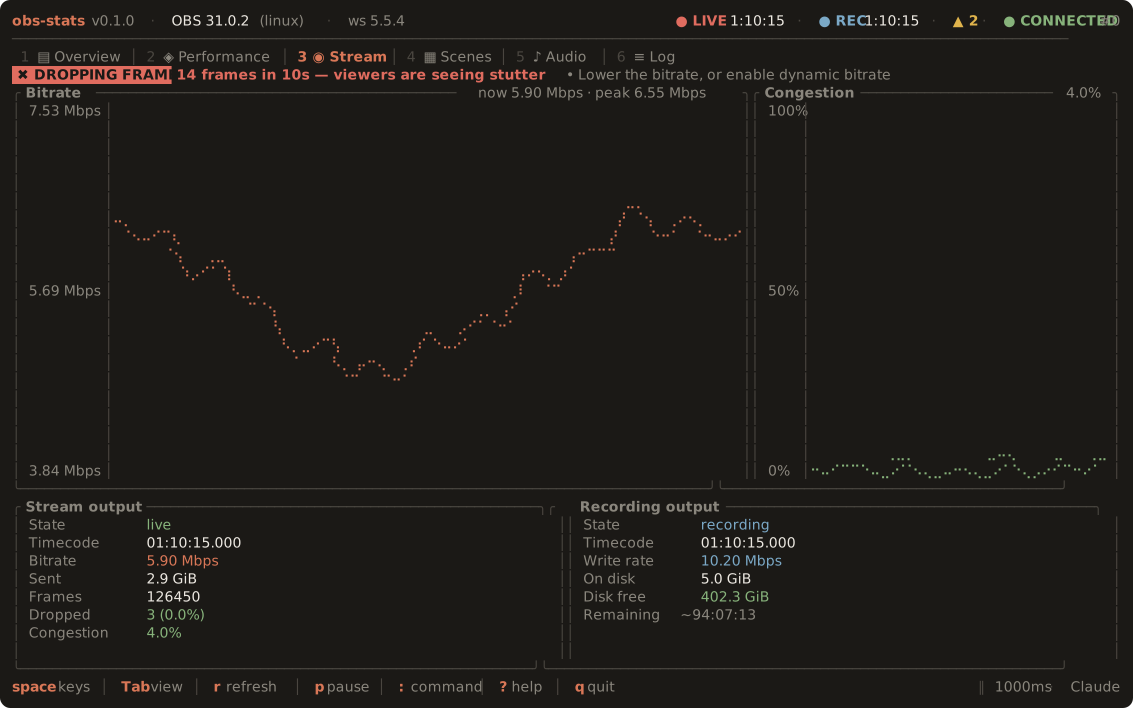
3Everything OBS reports about both outputs, with a bitrate chart, a congestion trend, and a “how much longer can I record?” estimate from the write rate and free disk.
Scenes
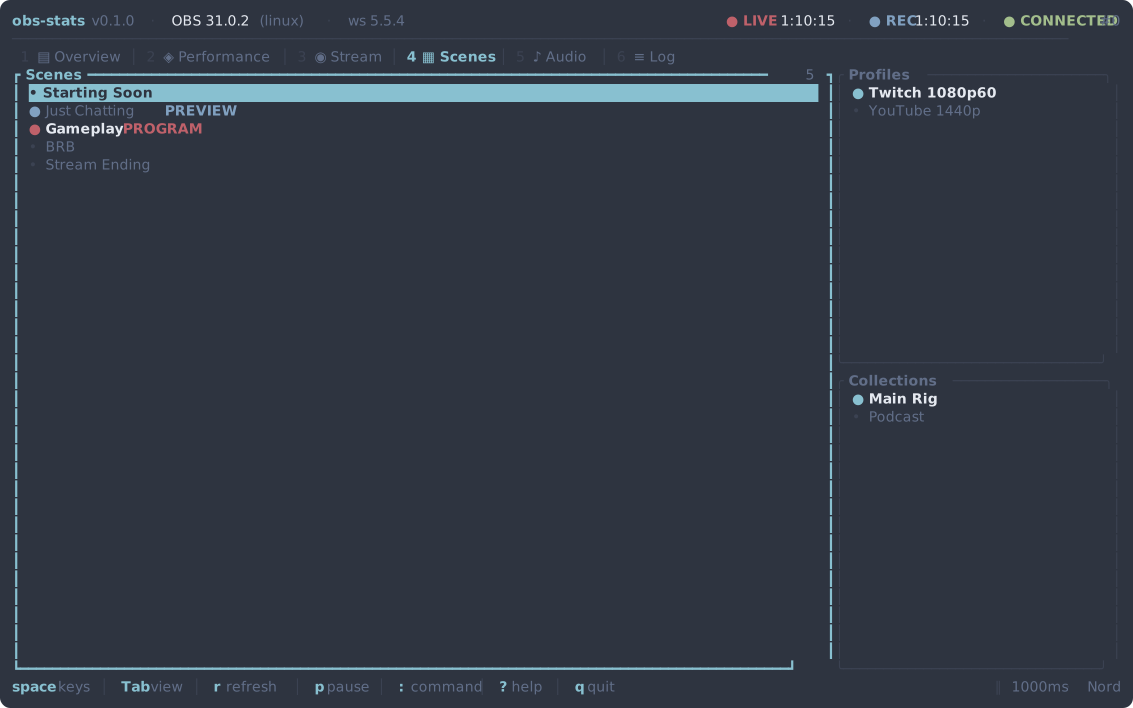
4The scene list with program and preview tagged, beside the active profile and scene collection. Read-only — this is a monitor, not a control surface.
Audio
5Every audio-bearing input with its fader position and a live peak meter, on a dB scale with a −60 dBFS floor. Segments turn amber before you clip.
Log
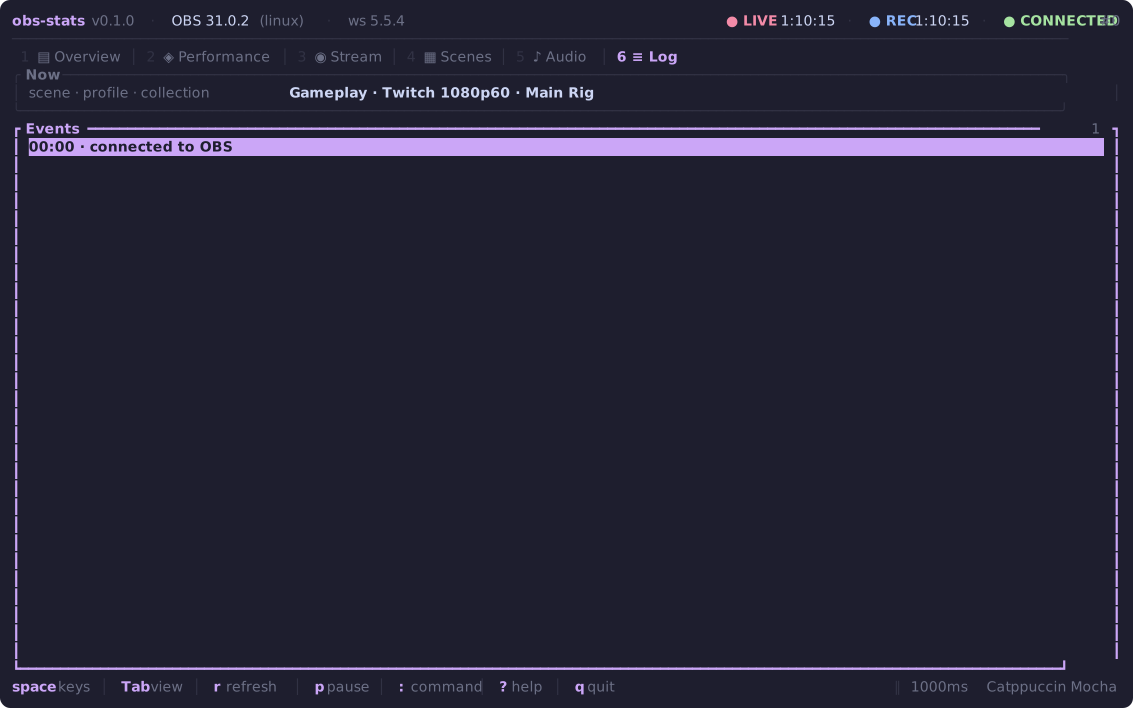
6Scene switches, output state changes and mute toggles, timestamped relative to start — so “how long before the drop did the scene change?” isn't arithmetic.
You get told when it matters
The dashboard is only useful if you are looking at it, and while you are streaming you are not. So frames actually being lost raise a banner across every view — and a Linux desktop notification, so it reaches you behind a full-screen scene.
Rate, not totals
A stream that dropped forty frames an hour ago and none since is healthy. Alerts fire on frames lost within a rolling window, so they mean “right now”.
Quiet by default
A threshold, a rolling window, a cooldown, and only while an output is running. One stray frame in a 60 fps stream will not train you to ignore the alert.
No false starts
The first poll only sets a baseline, and a counter going backwards — every output restart — counts as zero loss rather than an enormous one.
Nothing to install
Notifications speak D-Bus directly with a pure-Rust client. No libnotify to link, no notify-send to shell out to, and the binary stays static.
Never blocks a frame
Delivery runs on its own thread. A wedged notification daemon cannot stall the render loop, and after three failures obs-stats stops trying.
Degrades quietly
No session bus — a TTY, ssh, a container — and notifications are skipped automatically. The banner still works, and so does the log.
| Alert | Cause |
|---|---|
| DROPPING FRAMES | Network could not deliver encoded frames |
| RECONNECTING | The stream dropped |
| ENCODER LAG | Encoder could not keep up |
| RENDER LAG | Renderer could not build frames in time |
| Control | Effect |
|---|---|
--no-notify | Keep the banner, skip the desktop |
--no-alerts | Turn the whole thing off |
min_frames | How many lost frames it takes |
cooldown_seconds | Minimum gap per cause |
Notifications are Linux-only — on macOS and Windows the dependency is not even compiled in, and alerts appear in the dashboard alone. Full detail and tuning in docs/alerts.md.
What the numbers mean
The full guide lives in docs/metrics.md. The short version:
| Symptom | Cause |
|---|---|
| Renderer skipped | GPU — too many sources, heavy filters, a busy game |
| Encoder skipped | CPU or encoder — preset too slow, no hardware encoder |
| Network dropped | Uplink — not enough bandwidth, congestion, packet loss |
| Congestion rising | The uplink, about to start dropping |
| Frame budget | Meaning |
|---|---|
| under 50% | Comfortable |
| 50–80% | Strained; a spike will cost frames |
| over 80% | On the edge; skips imminent |
| — | 16.7 ms at 60 fps, 33.3 ms at 30 |
Keyboard first
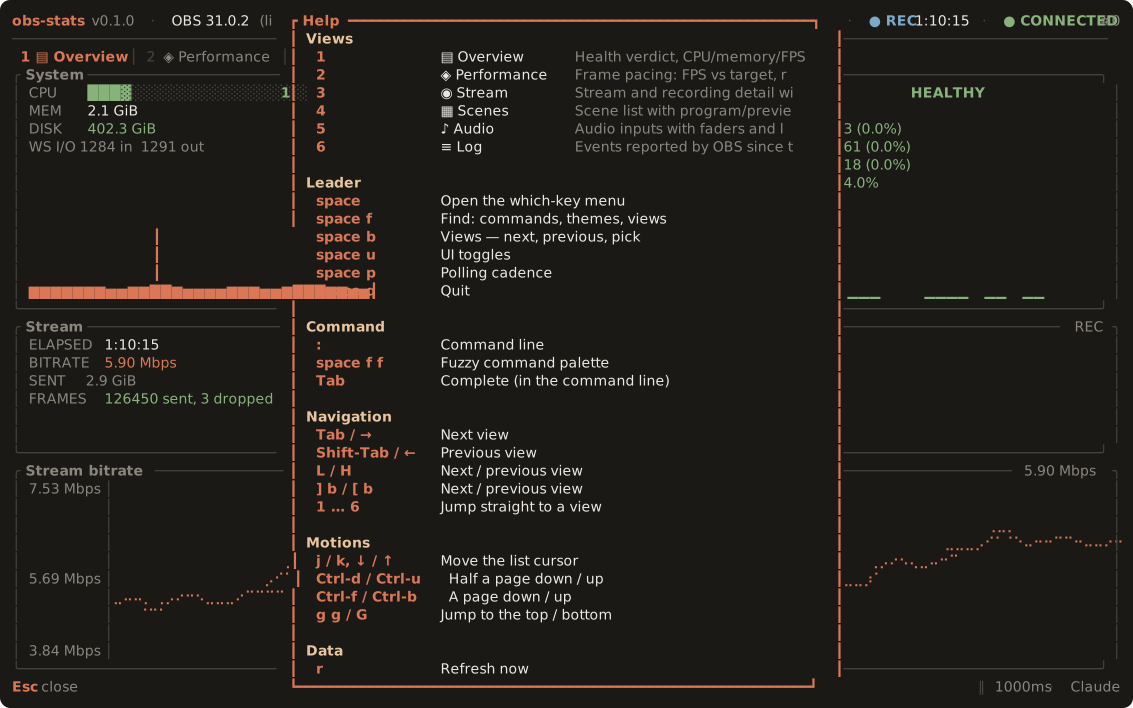
Vim keys or arrows, digits to jump, mouse optional. Press ? in the app for the same table, generated from the keymap itself.
| Key | Navigation |
|---|---|
| Tab / ⇧Tab | Next / previous view |
| 1 … 6 | Jump to a view |
| j k | Move the list cursor |
| g / G | Top / bottom |
| Key | Data & display |
|---|---|
| r | Refresh now |
| space | Pause the display |
| + / − | Poll faster / slower |
| t / F2 | Theme picker |
24 themes, previewed live
Press F2. Moving the cursor restyles the entire UI, not just a swatch — Enter keeps it, Esc puts the old one back.
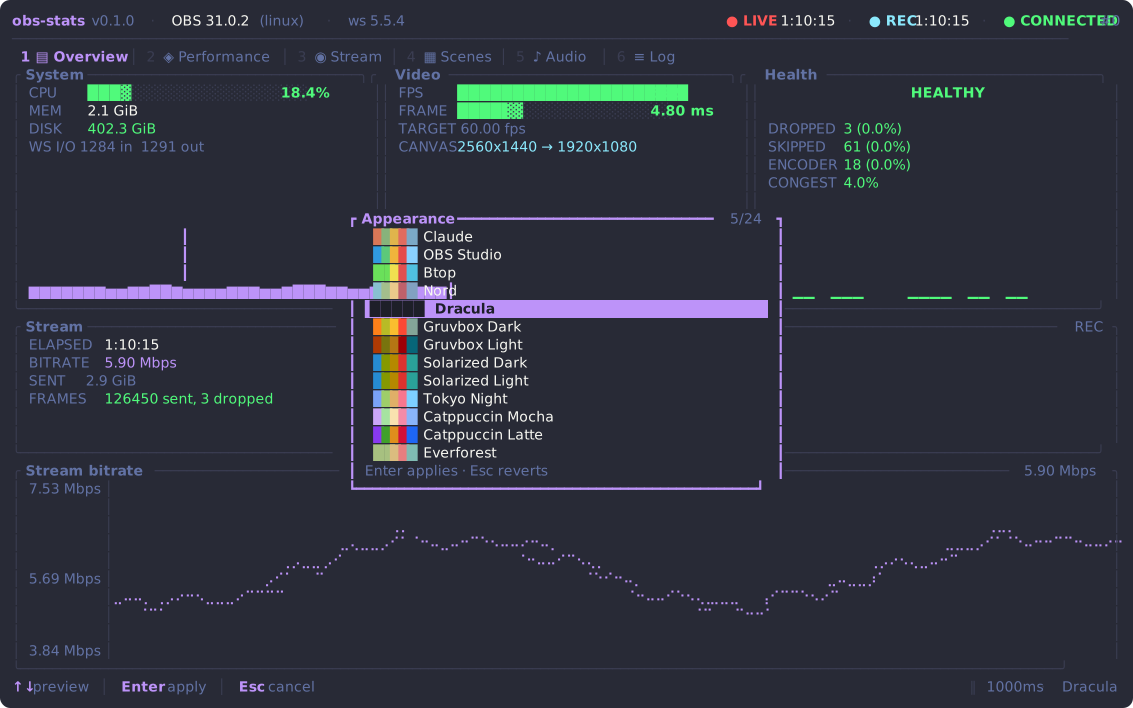
mono uses only the 16 ANSI colours and never paints a background of its own —
right for a Linux virtual console. Pair it with --ascii when the font lacks
box-drawing glyphs. high-contrast distinguishes every state by more than
colour alone.
Install
A single static binary. No runtime, no daemon, no dependencies.
Then in OBS: Tools → WebSocket Server Settings → Enable WebSocket server,
export the password from Show Connect Info, and run obs-stats.
Prebuilt archives cover Linux (x86-64, aarch64, musl), macOS (Intel, Apple Silicon)
and Windows (x86-64).